Sales Analytics & Reporting
Gain immediate insights into your subscription business key
metrics and sales performance across the ecosystem

Learn more
Track all Your Sales Data Down to a Single Offer or Subscription Level
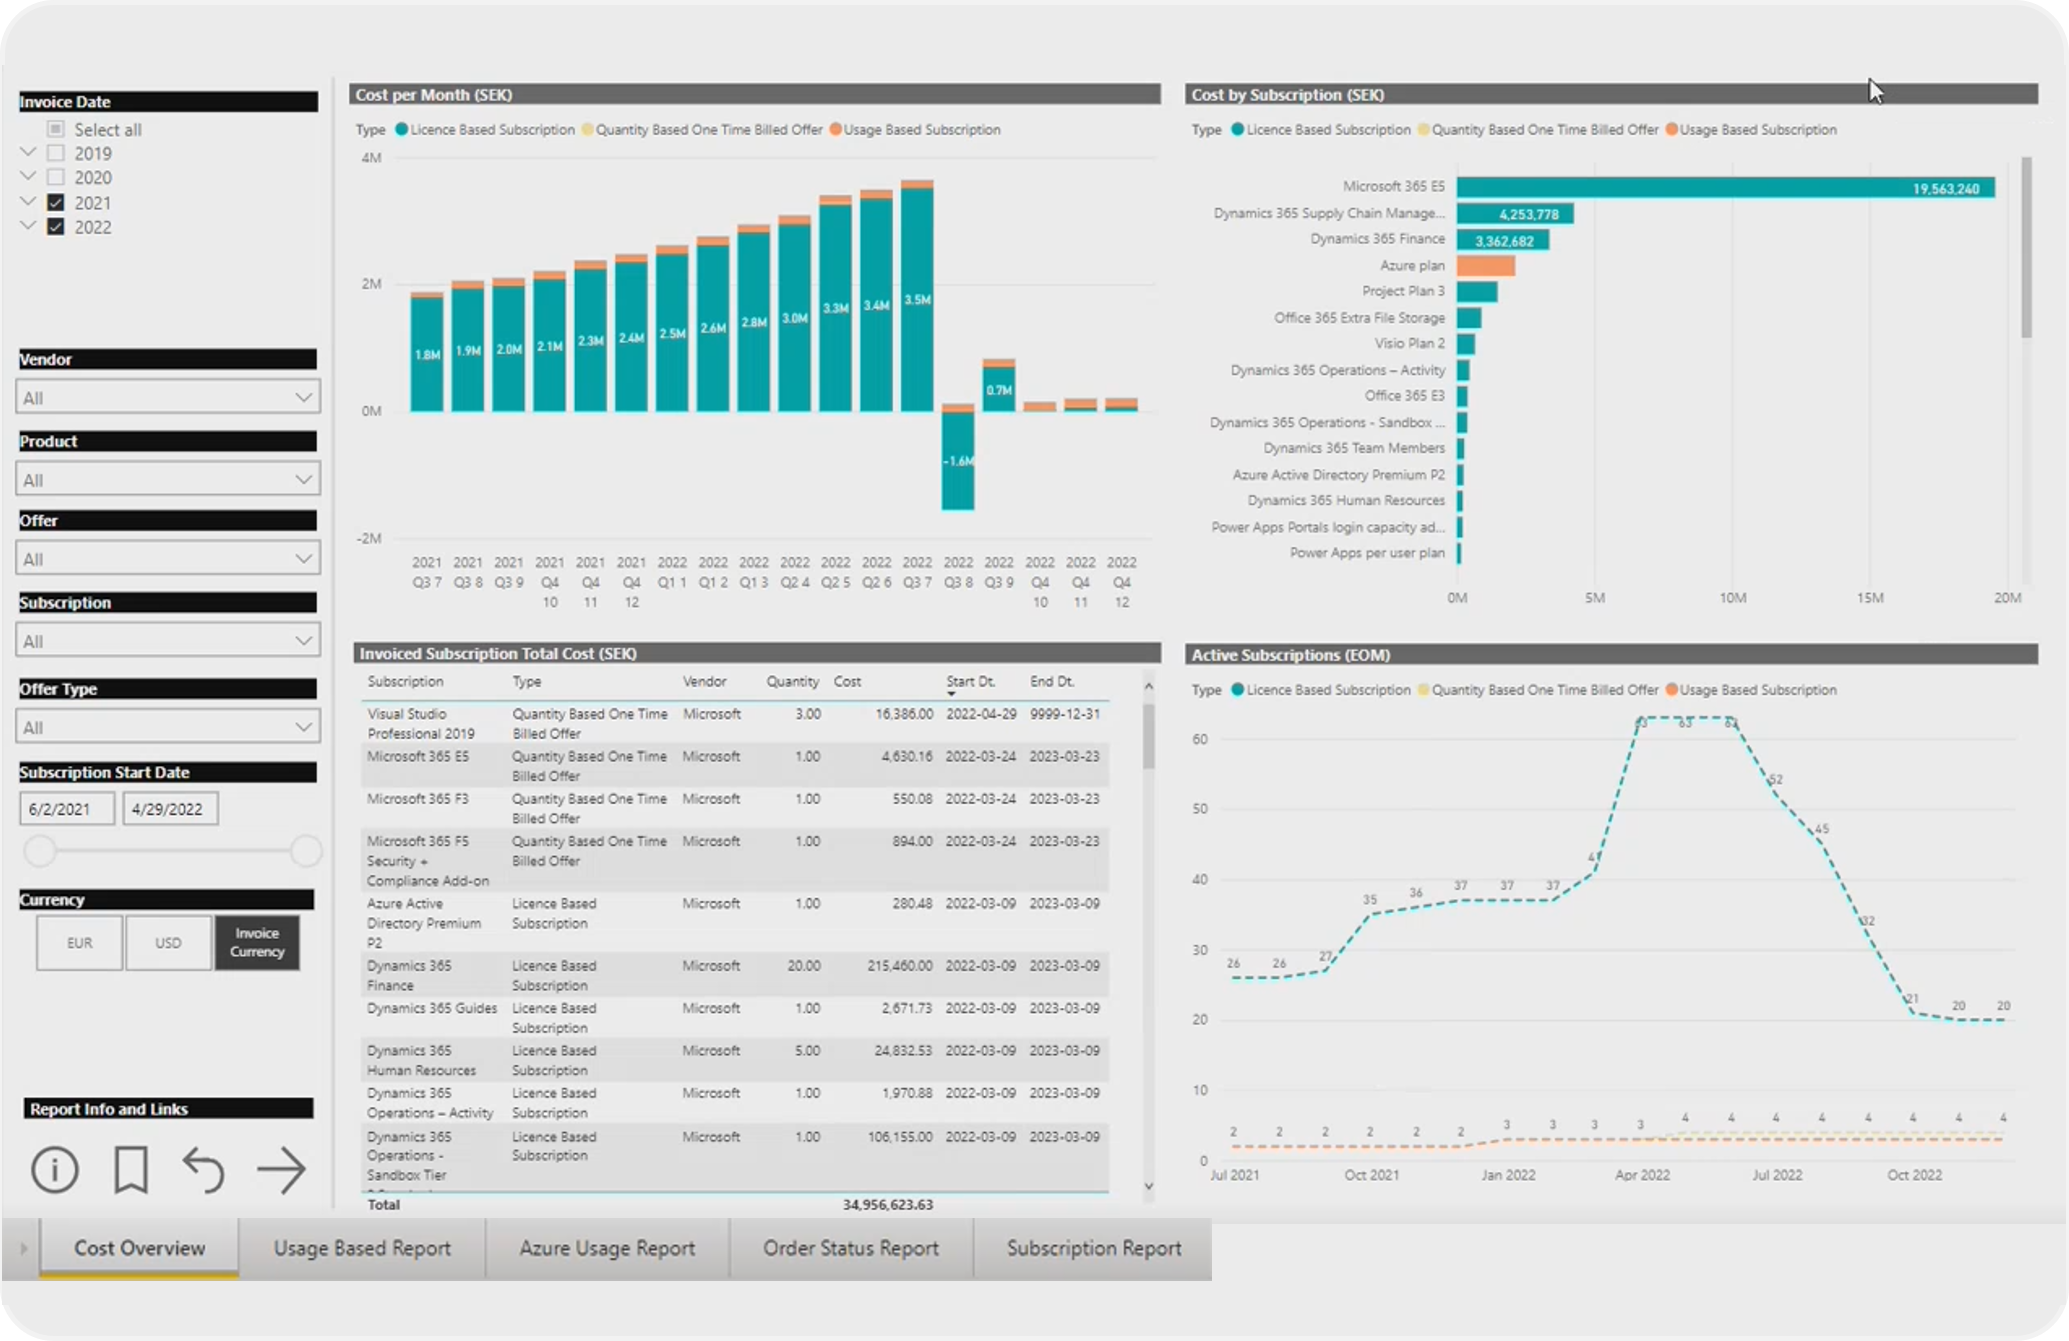
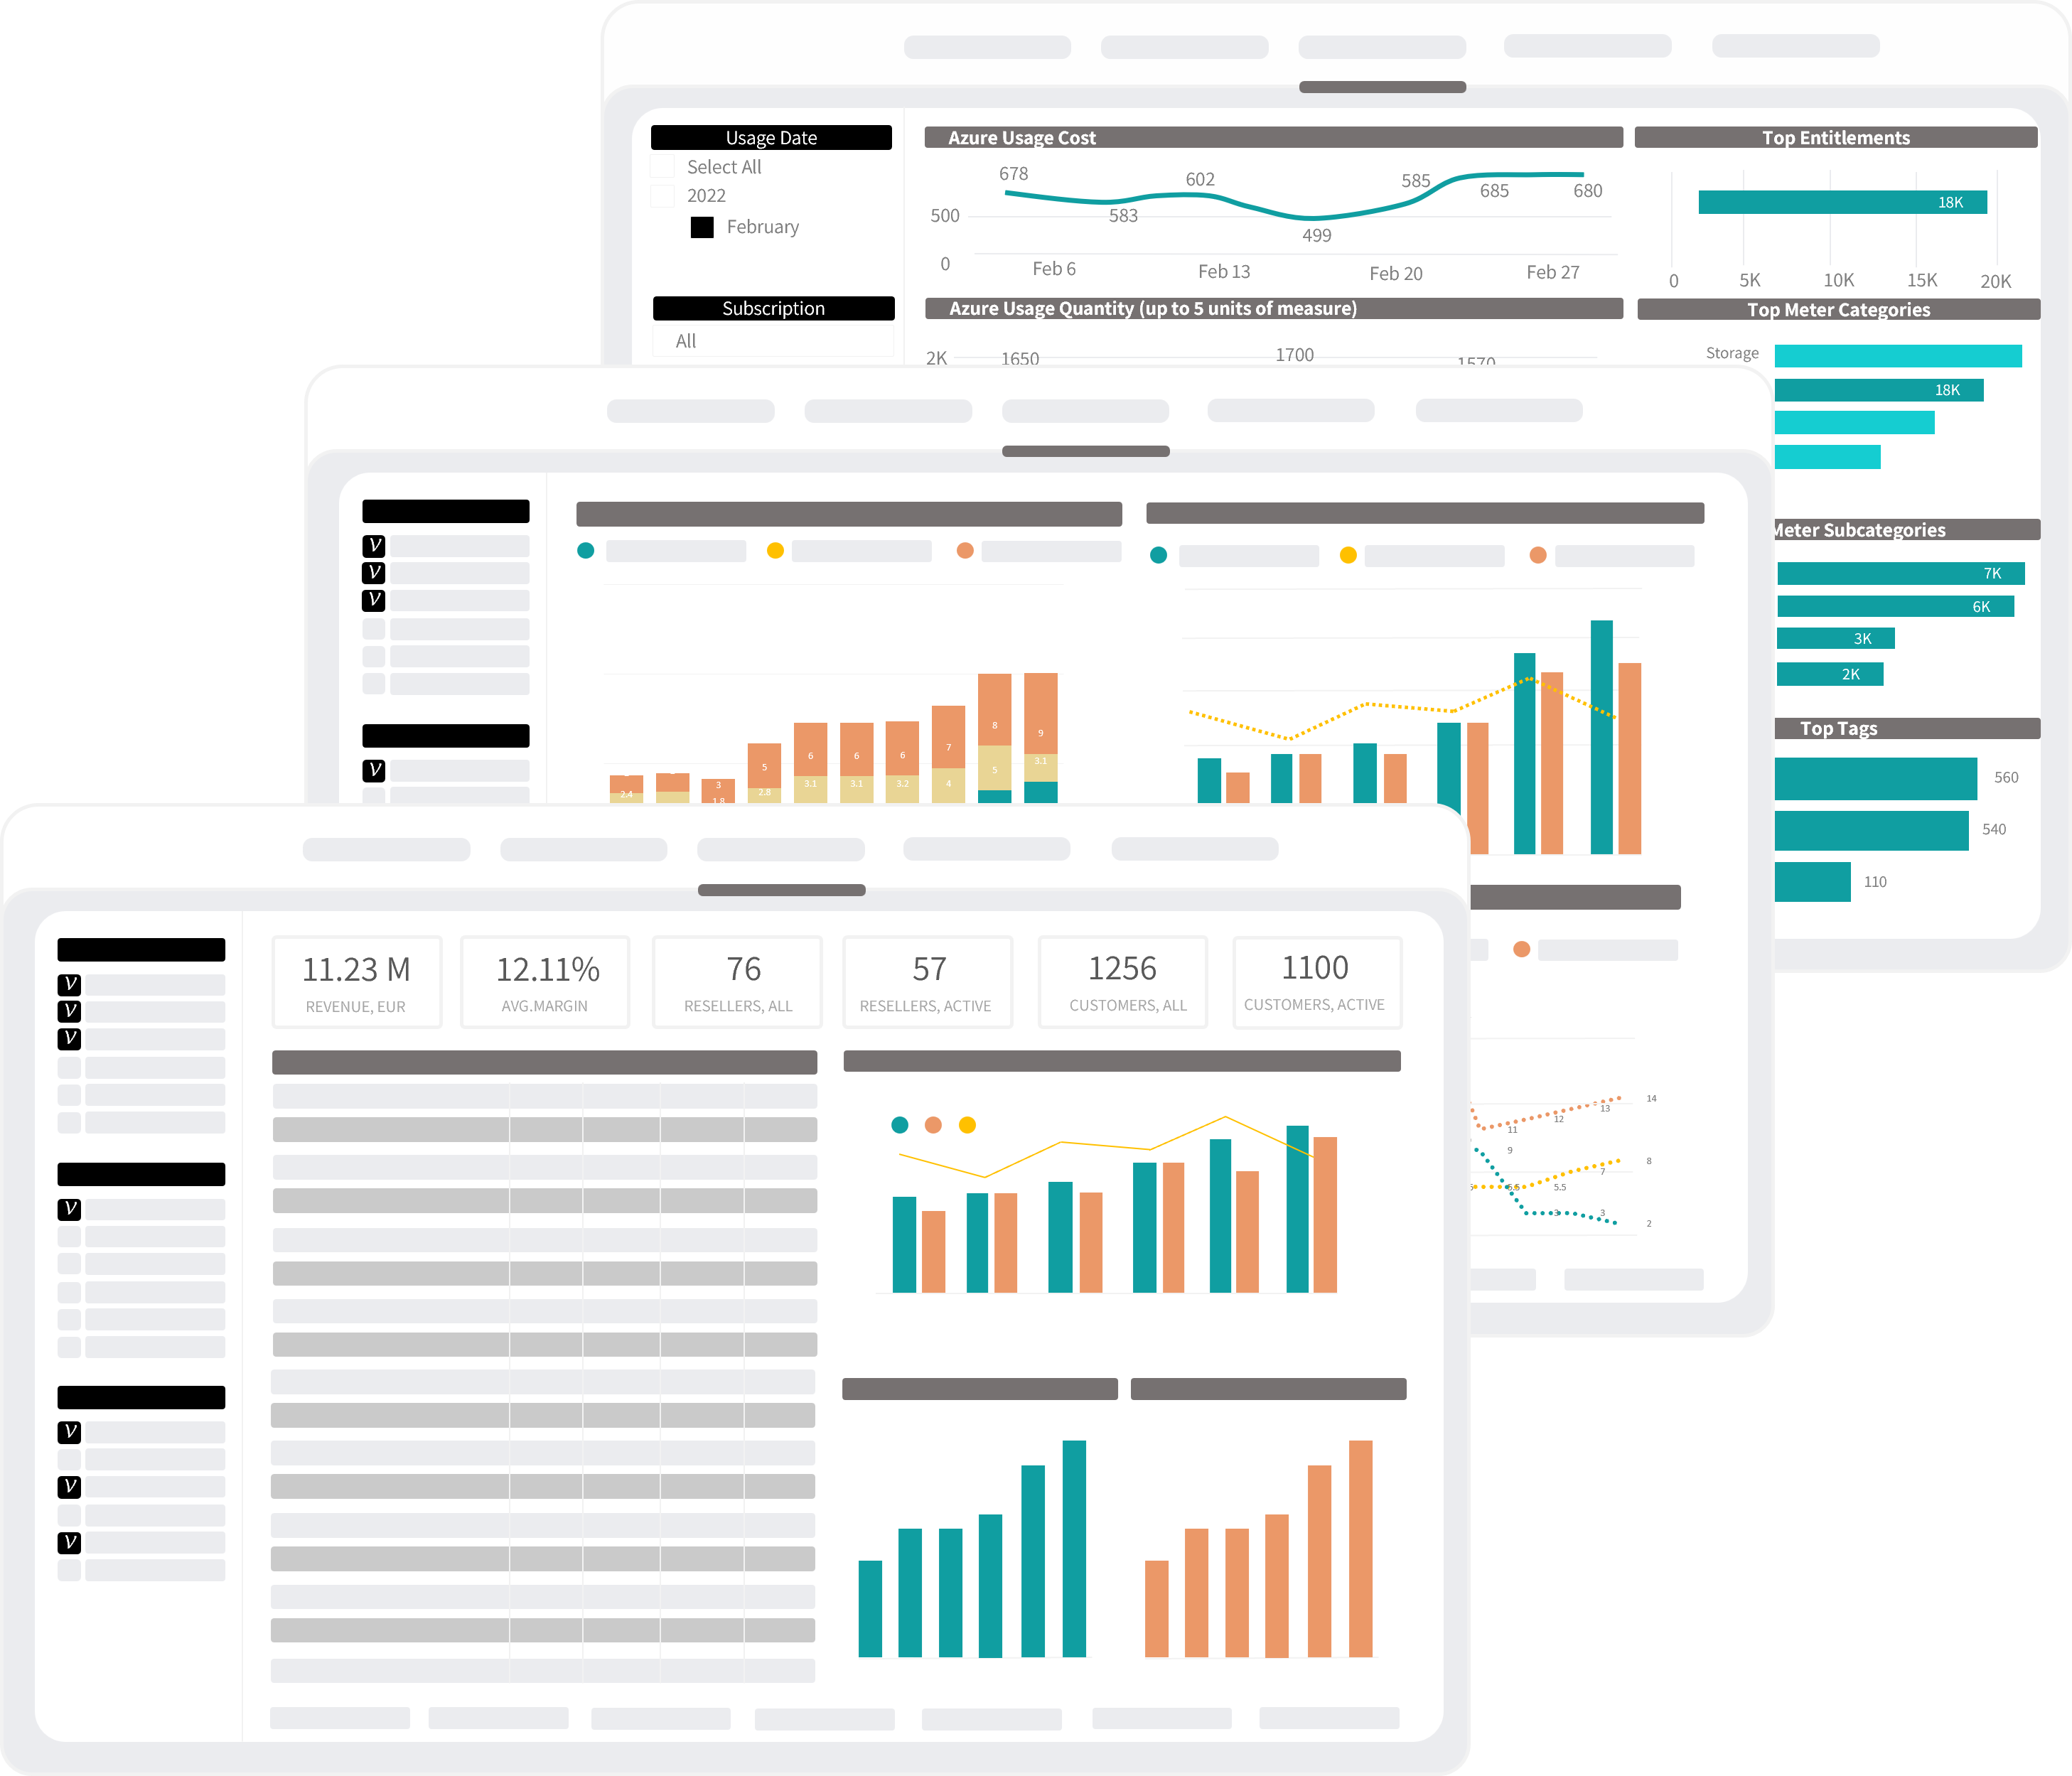
Leveraging intelligent data insights can be a game-changer for building sales strategy and scaling your SaaS business. Use AppXite built-in reports to keep track of all the subscription metrics along with important KPIs like sales margins, upcoming renewals, monthly recurring revenue (MRR), churn rate, and customer lifetime value. Integrated reporting capabilities of the AppXite Platform let distributors, sellers and customers analyze transaction data from multiple perspectives - financial indicators and sales performance, subscriptions and orders, customers and usage, and more!
Financial & Sales Performance
Comprehensive Revenue and Sales Performance Reports
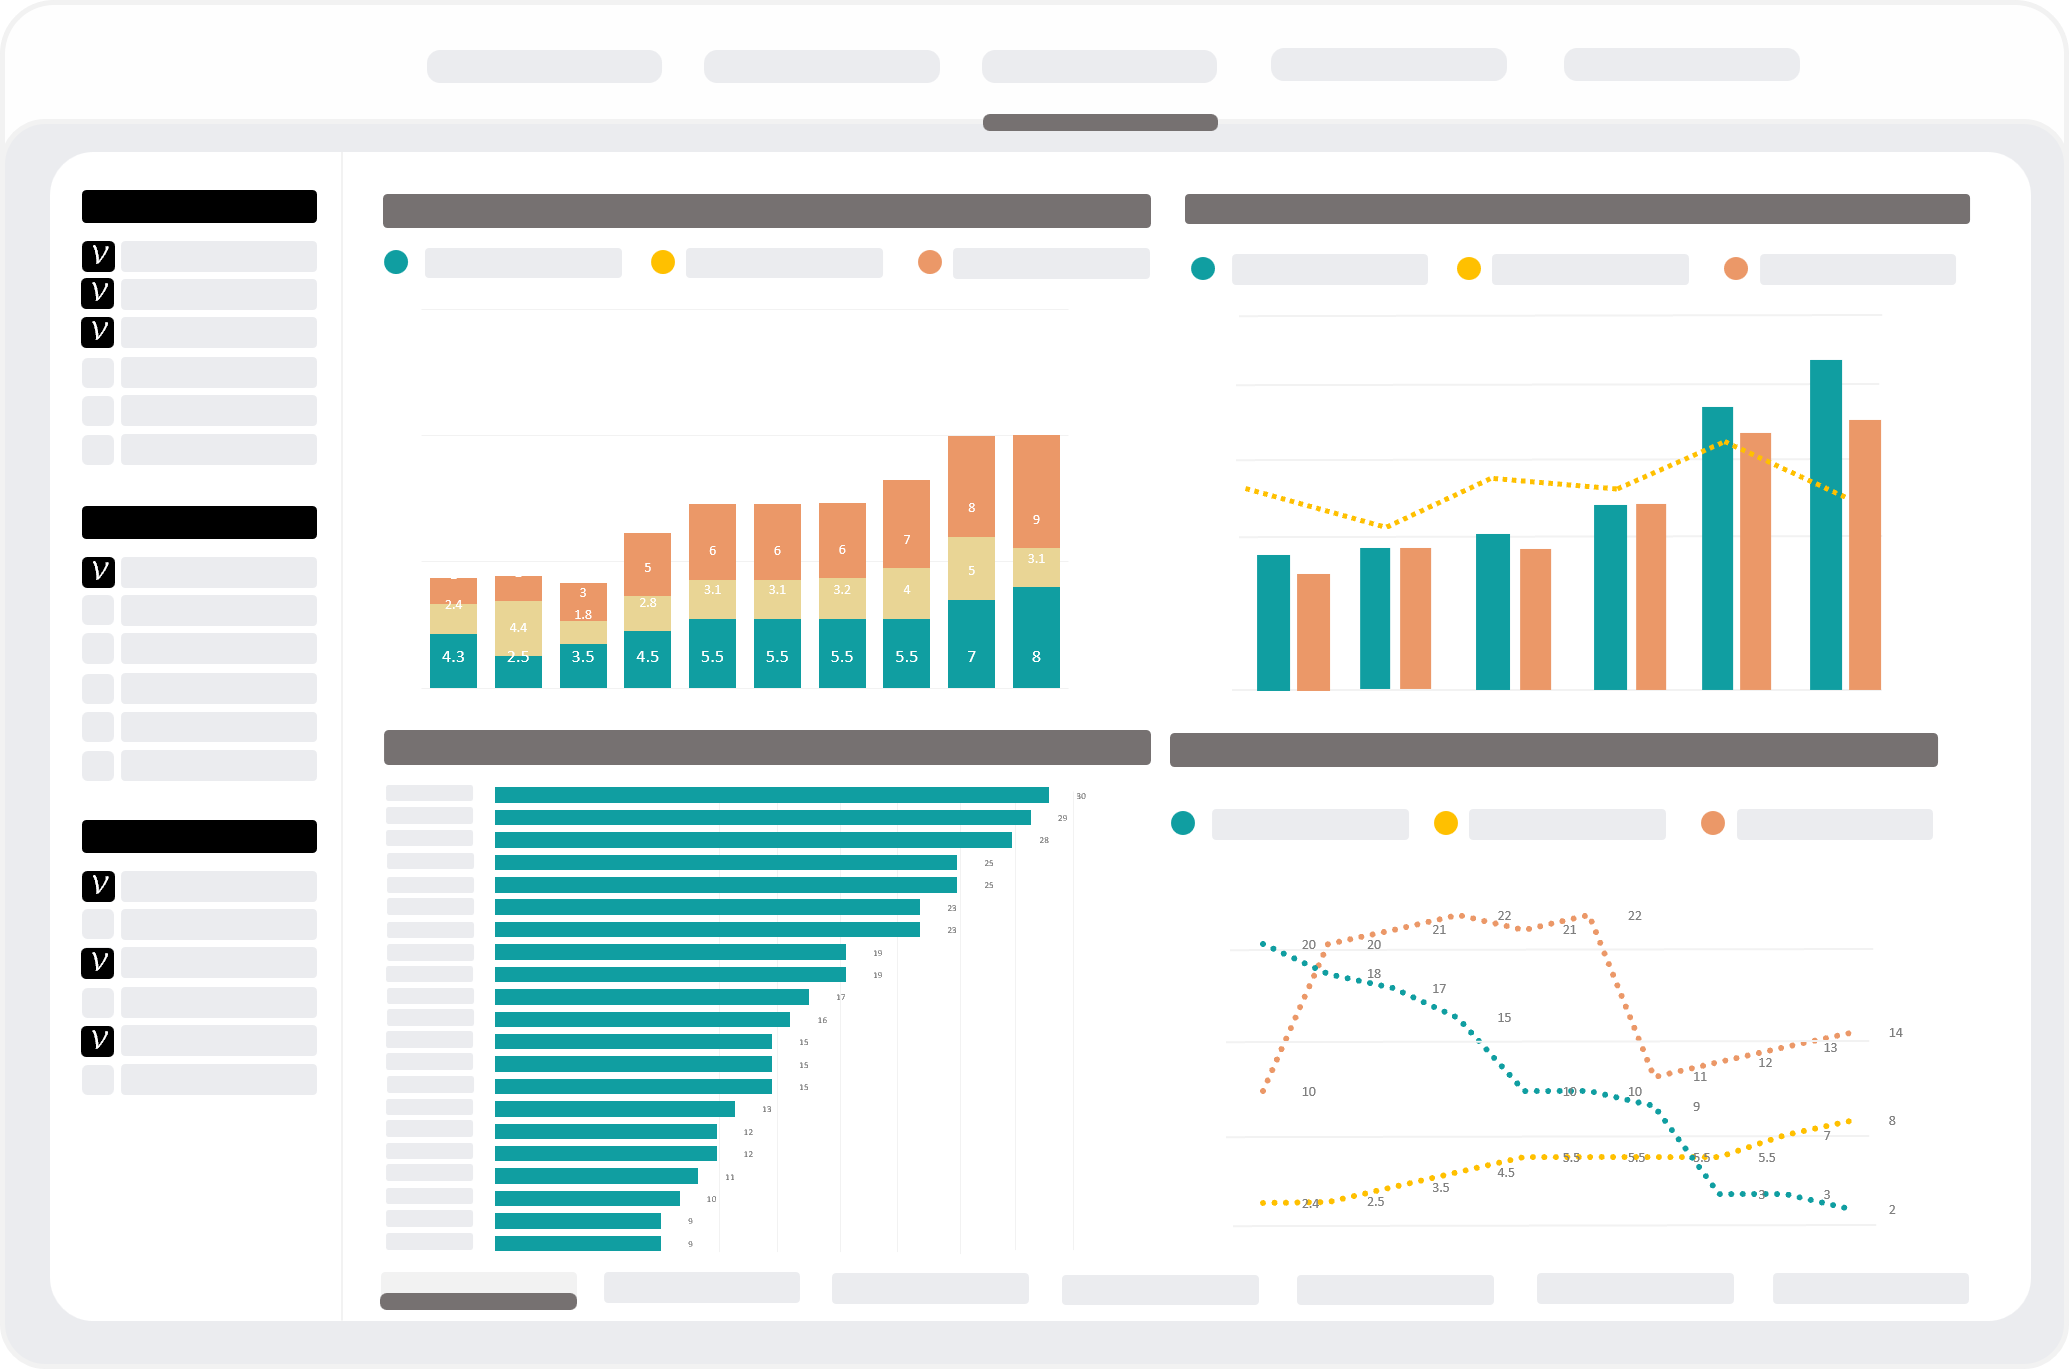
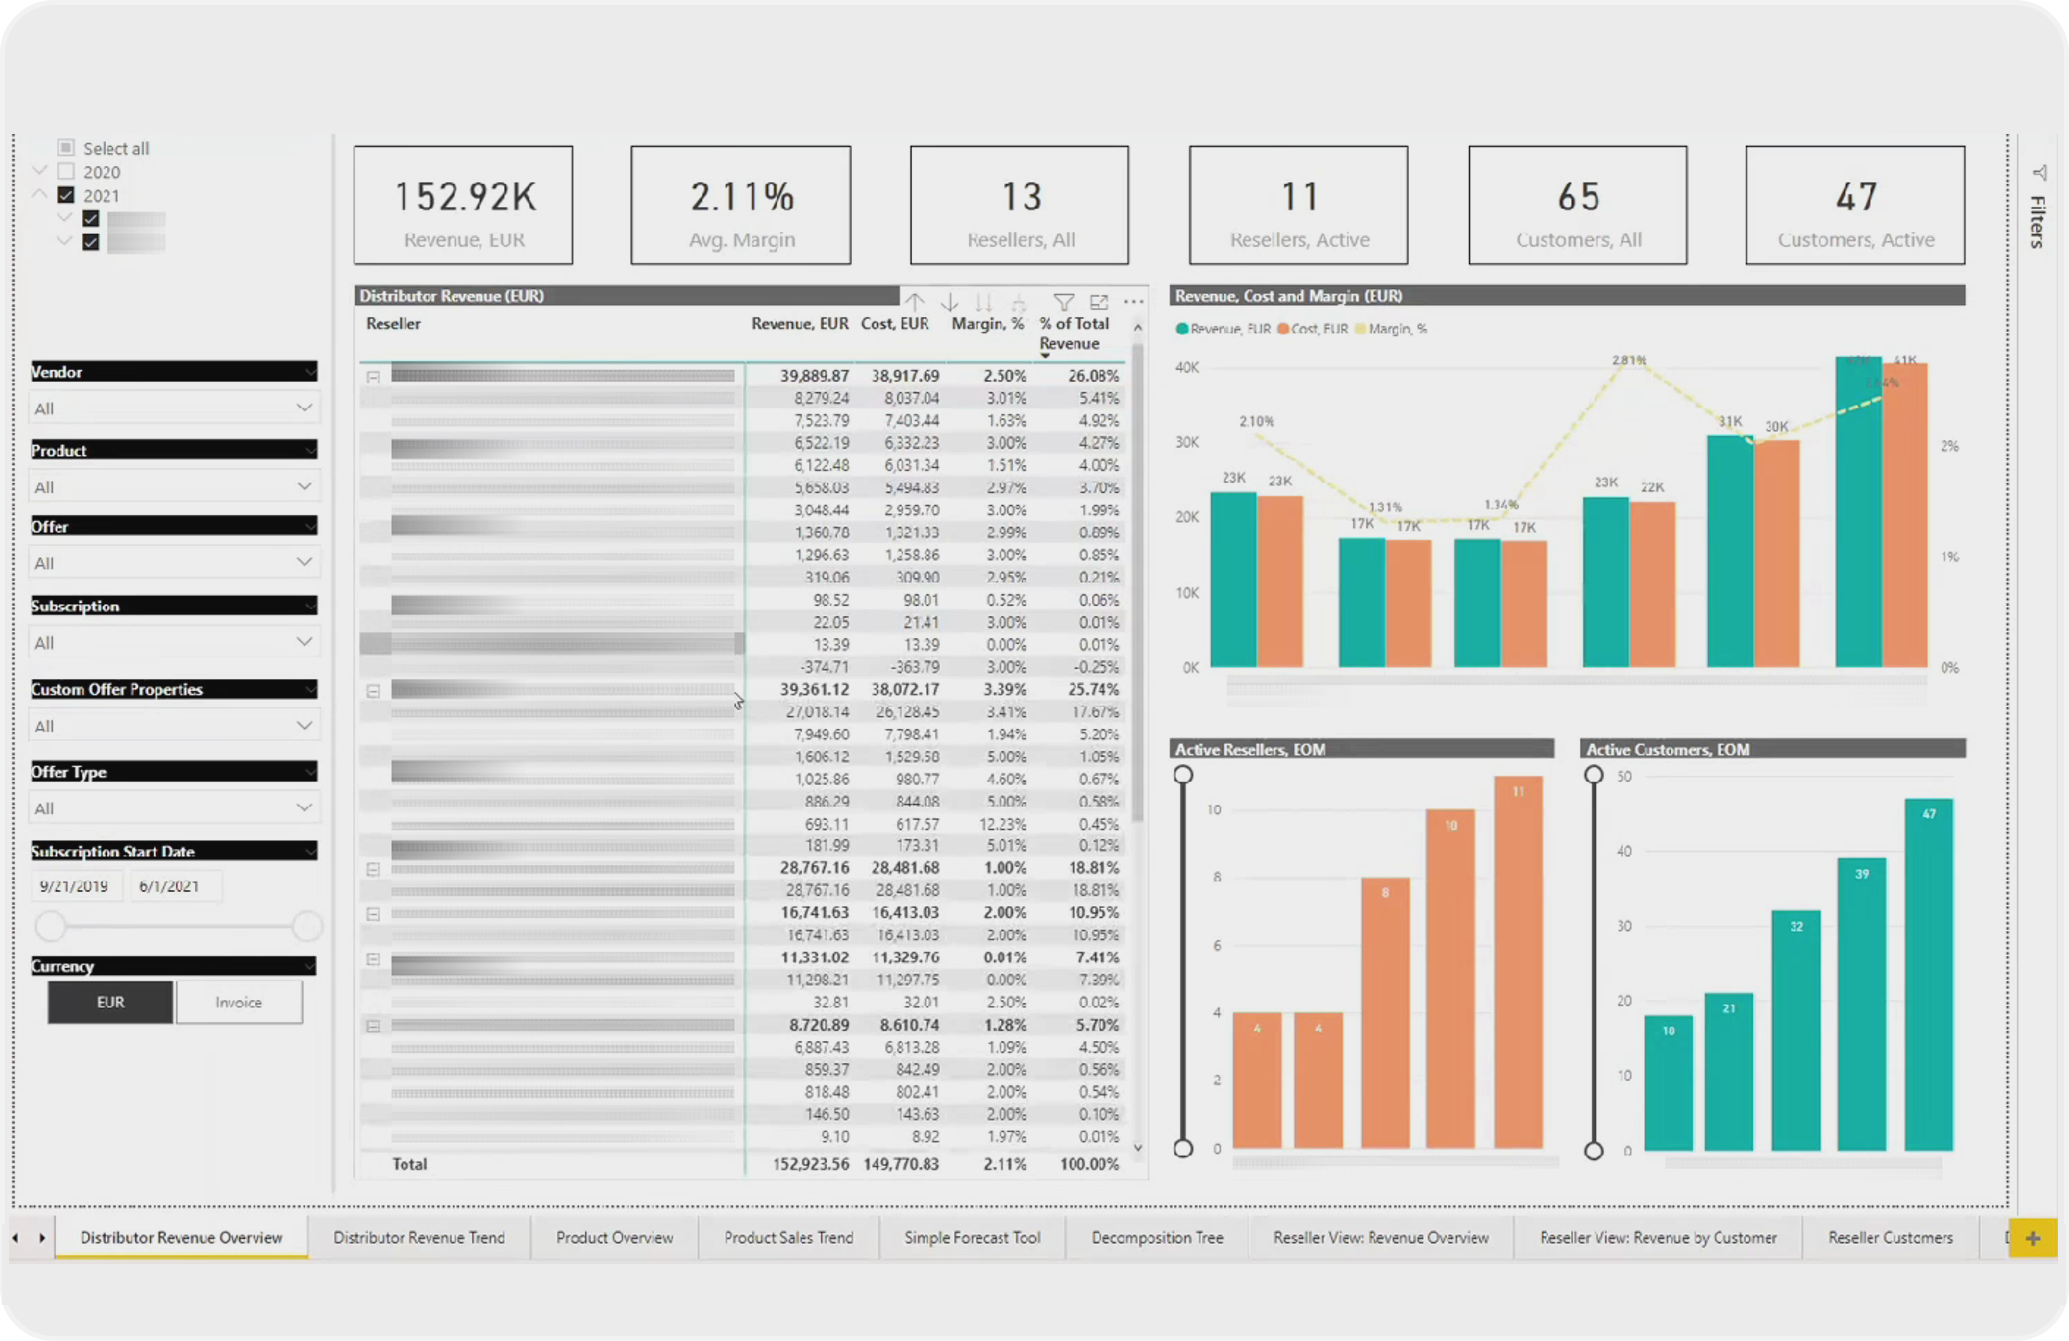
Generate comprehensive reports on revenue growth, cost and margin overview across the ecosystem and breakdown these indicators by products, customers, and subscriptions. Use a forecasting tool to analyze the revenue projections based on your data and monitor detailed revenue trends down to the single customer, vendor, product, offer and subscription.
Subscriptions & Orders
Get More Granular Details About Each Subscription and Order
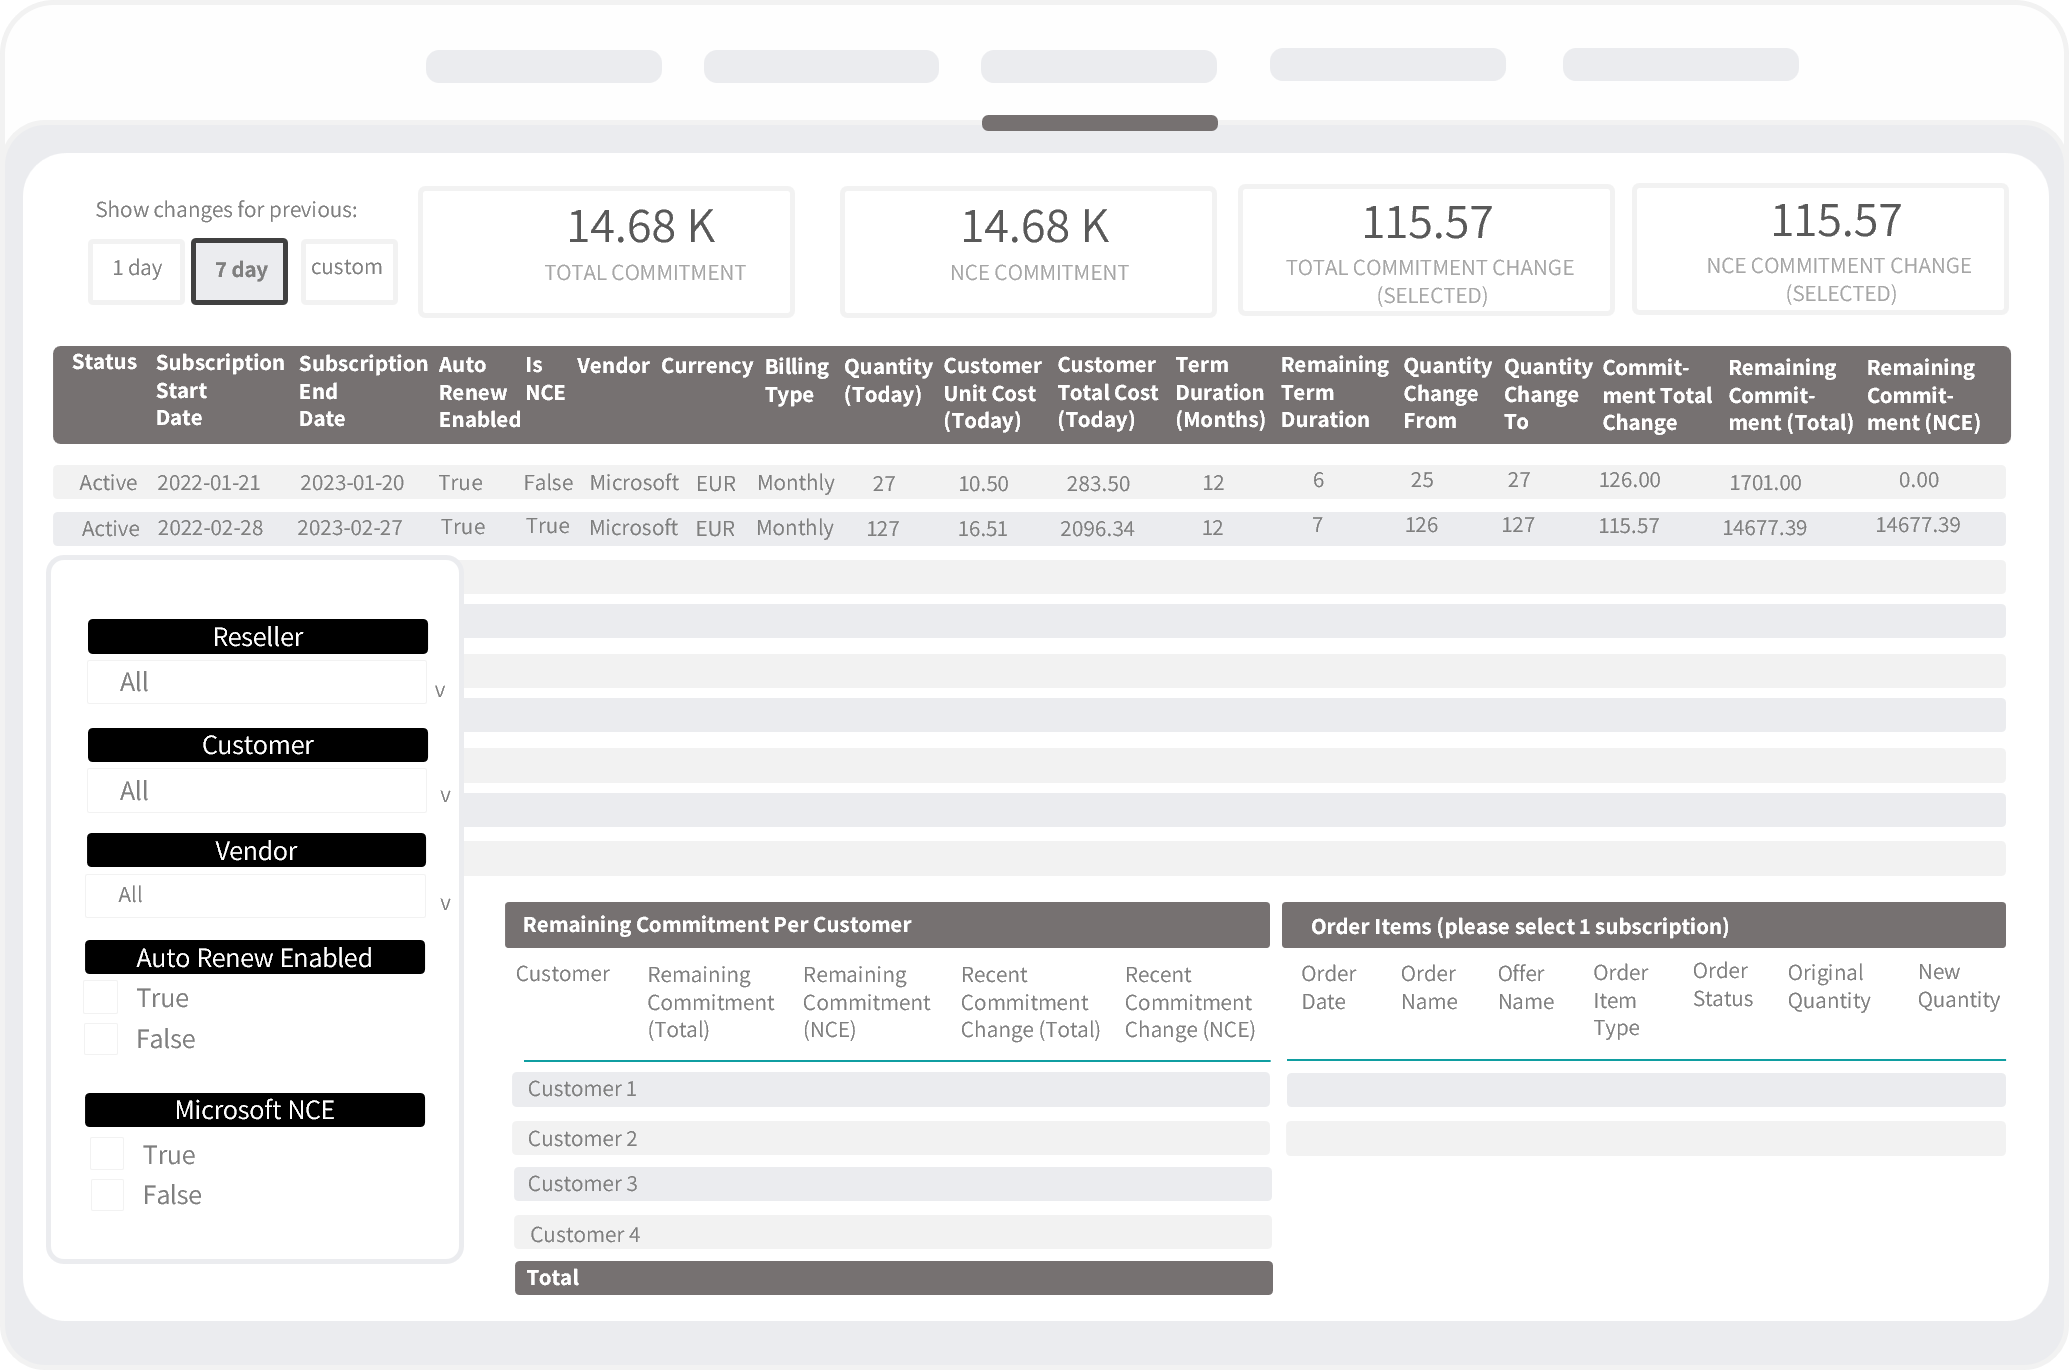
View all the events related to a particular subscription - upgrades, downgrades, renewals, pricing information, and more - in one place. Keep up with current price configurations for all your offers and improve the management of credit risk exposure - monitor recent changes in the total amount your reseller's customers have committed.
Customers & Usage
Gain Valuable Insights Into Your Reseller and Customer Base
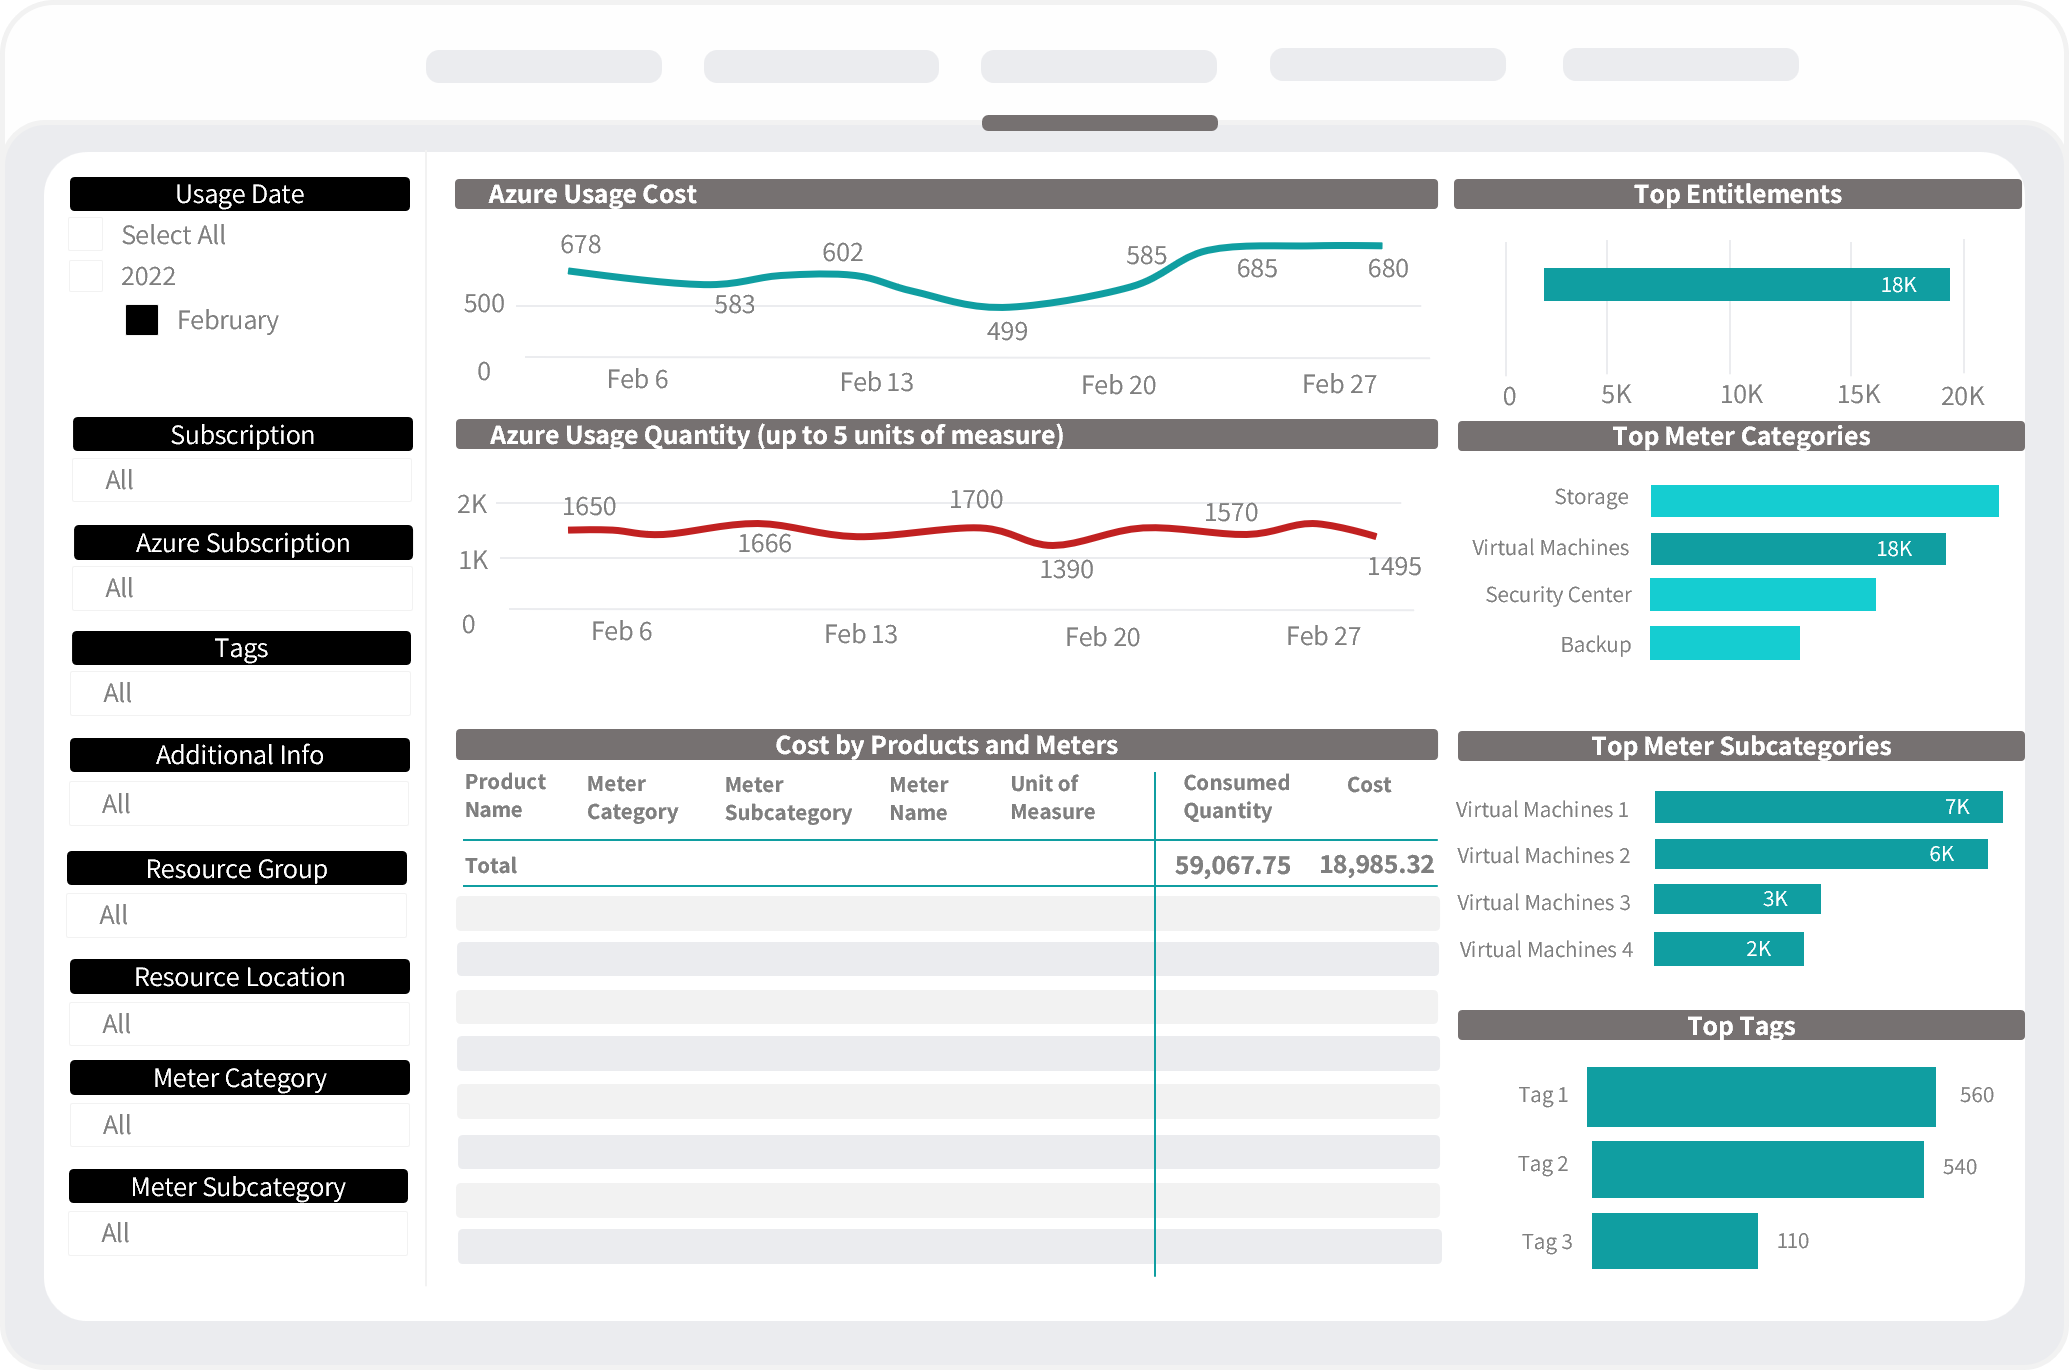
Find all your customer information in a structured way. Keep track of your or your customer's subscription usage behavior to understand the billing, monitor Azure or other subscription spending, and optimize resource use. Act proactively to increase software adaption and customer retention.
Data Exploration
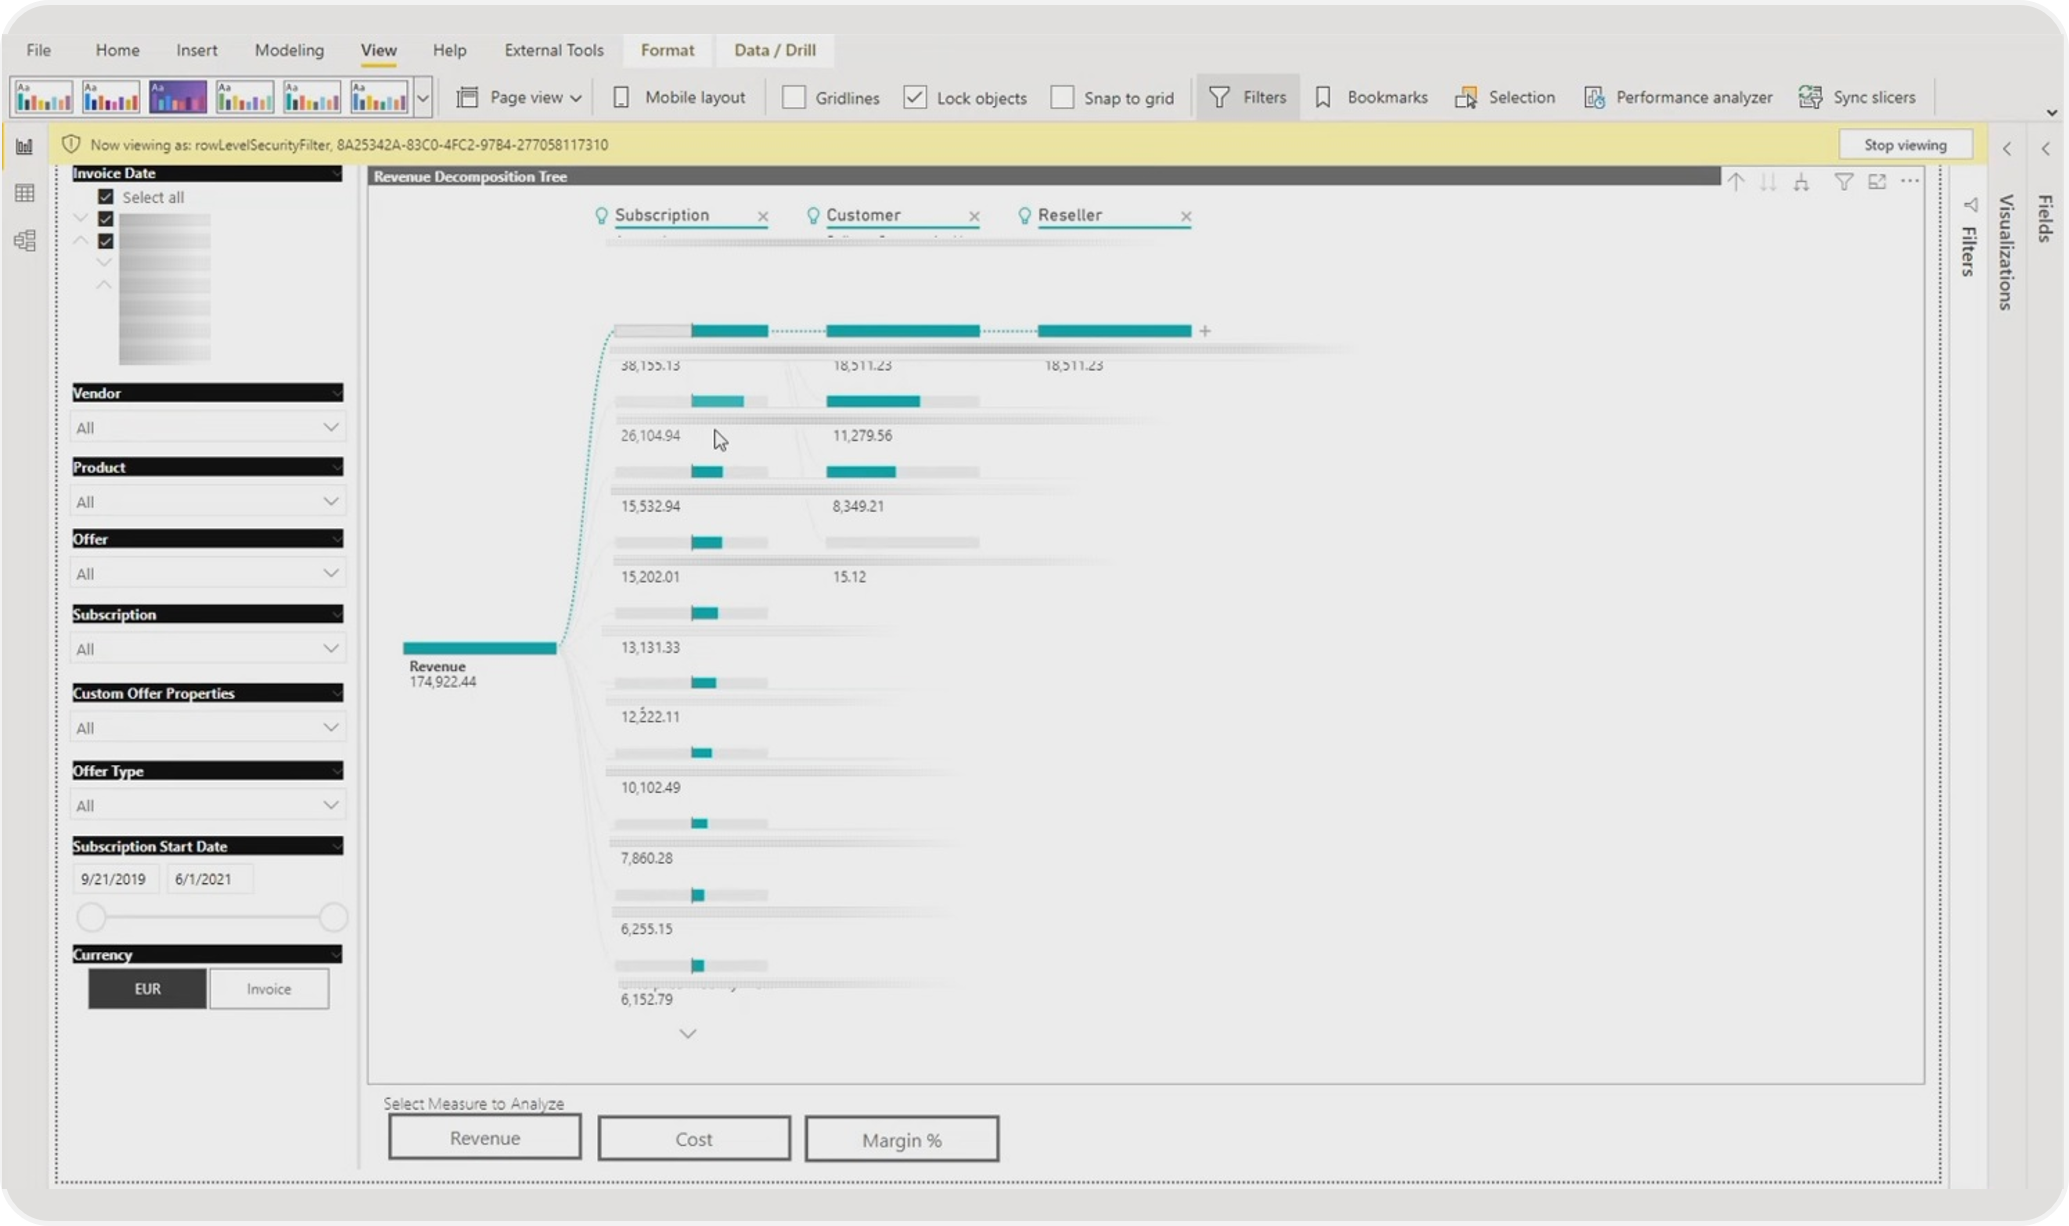
Financial Indicator Breakdown for Further Data Exploration
360° Report
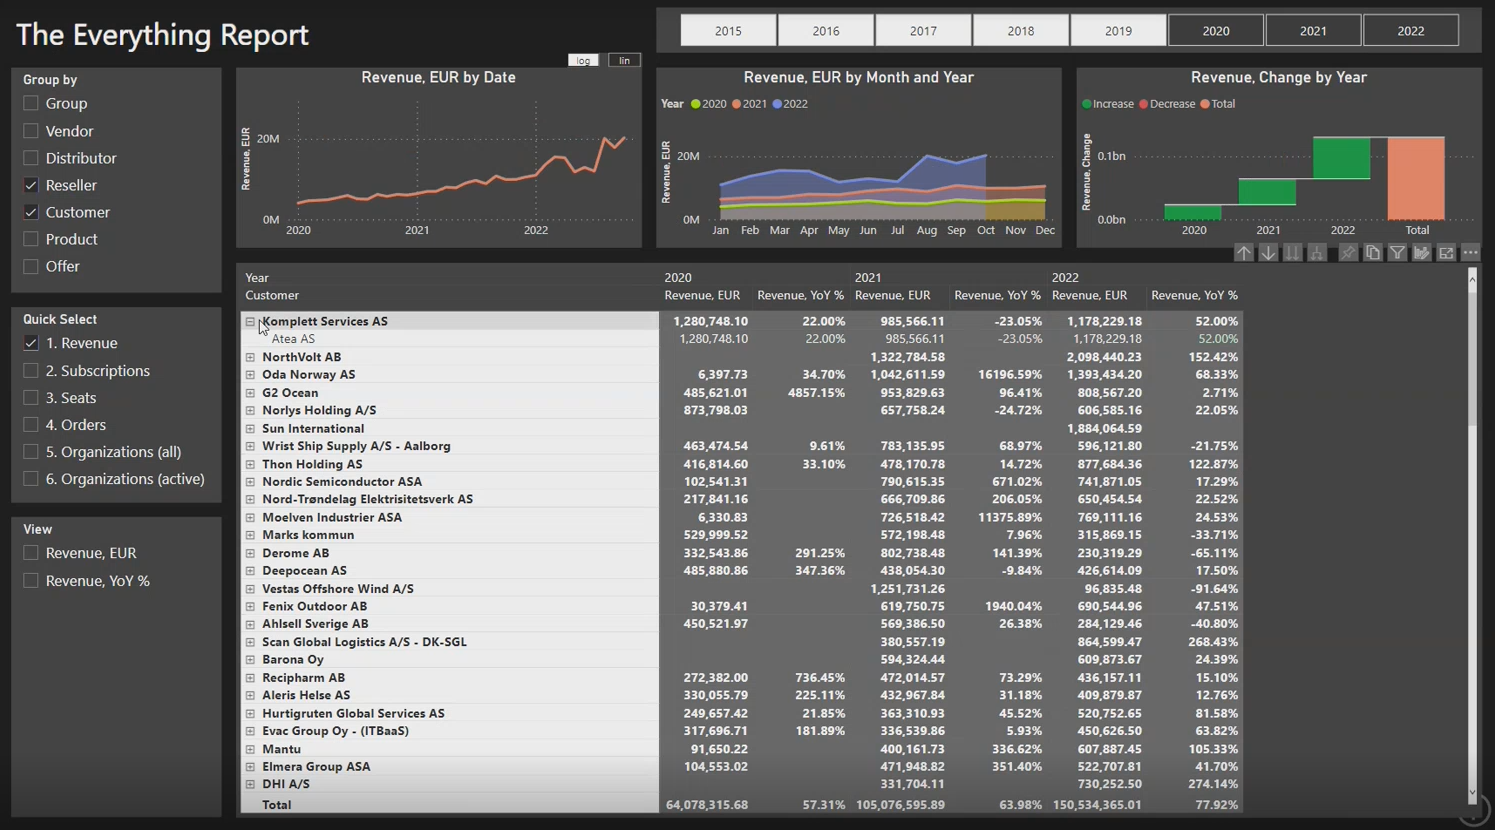
Get a 360° View to Build Your Data Story With Few Clicks
Why 360° Report?
⇒ Deeper Insights
Uncover a deeper level of actionable insights - advanced data grouping and a wide set of measures help to answer specific performance and business questions with a few clicks.
⇒ Better Data Exploration
Create your data story with data visualization and exploration functionality that enables you to better understand performance metrics by making raw data more comprehensible.
⇒ More Flexibility
Integrate data from other business applications to get a full picture. Customize reports based on data story and easily export it to Excel or straight to the presentation as a live report.
Meaningful Insights for Every Organization Across the Ecosystem
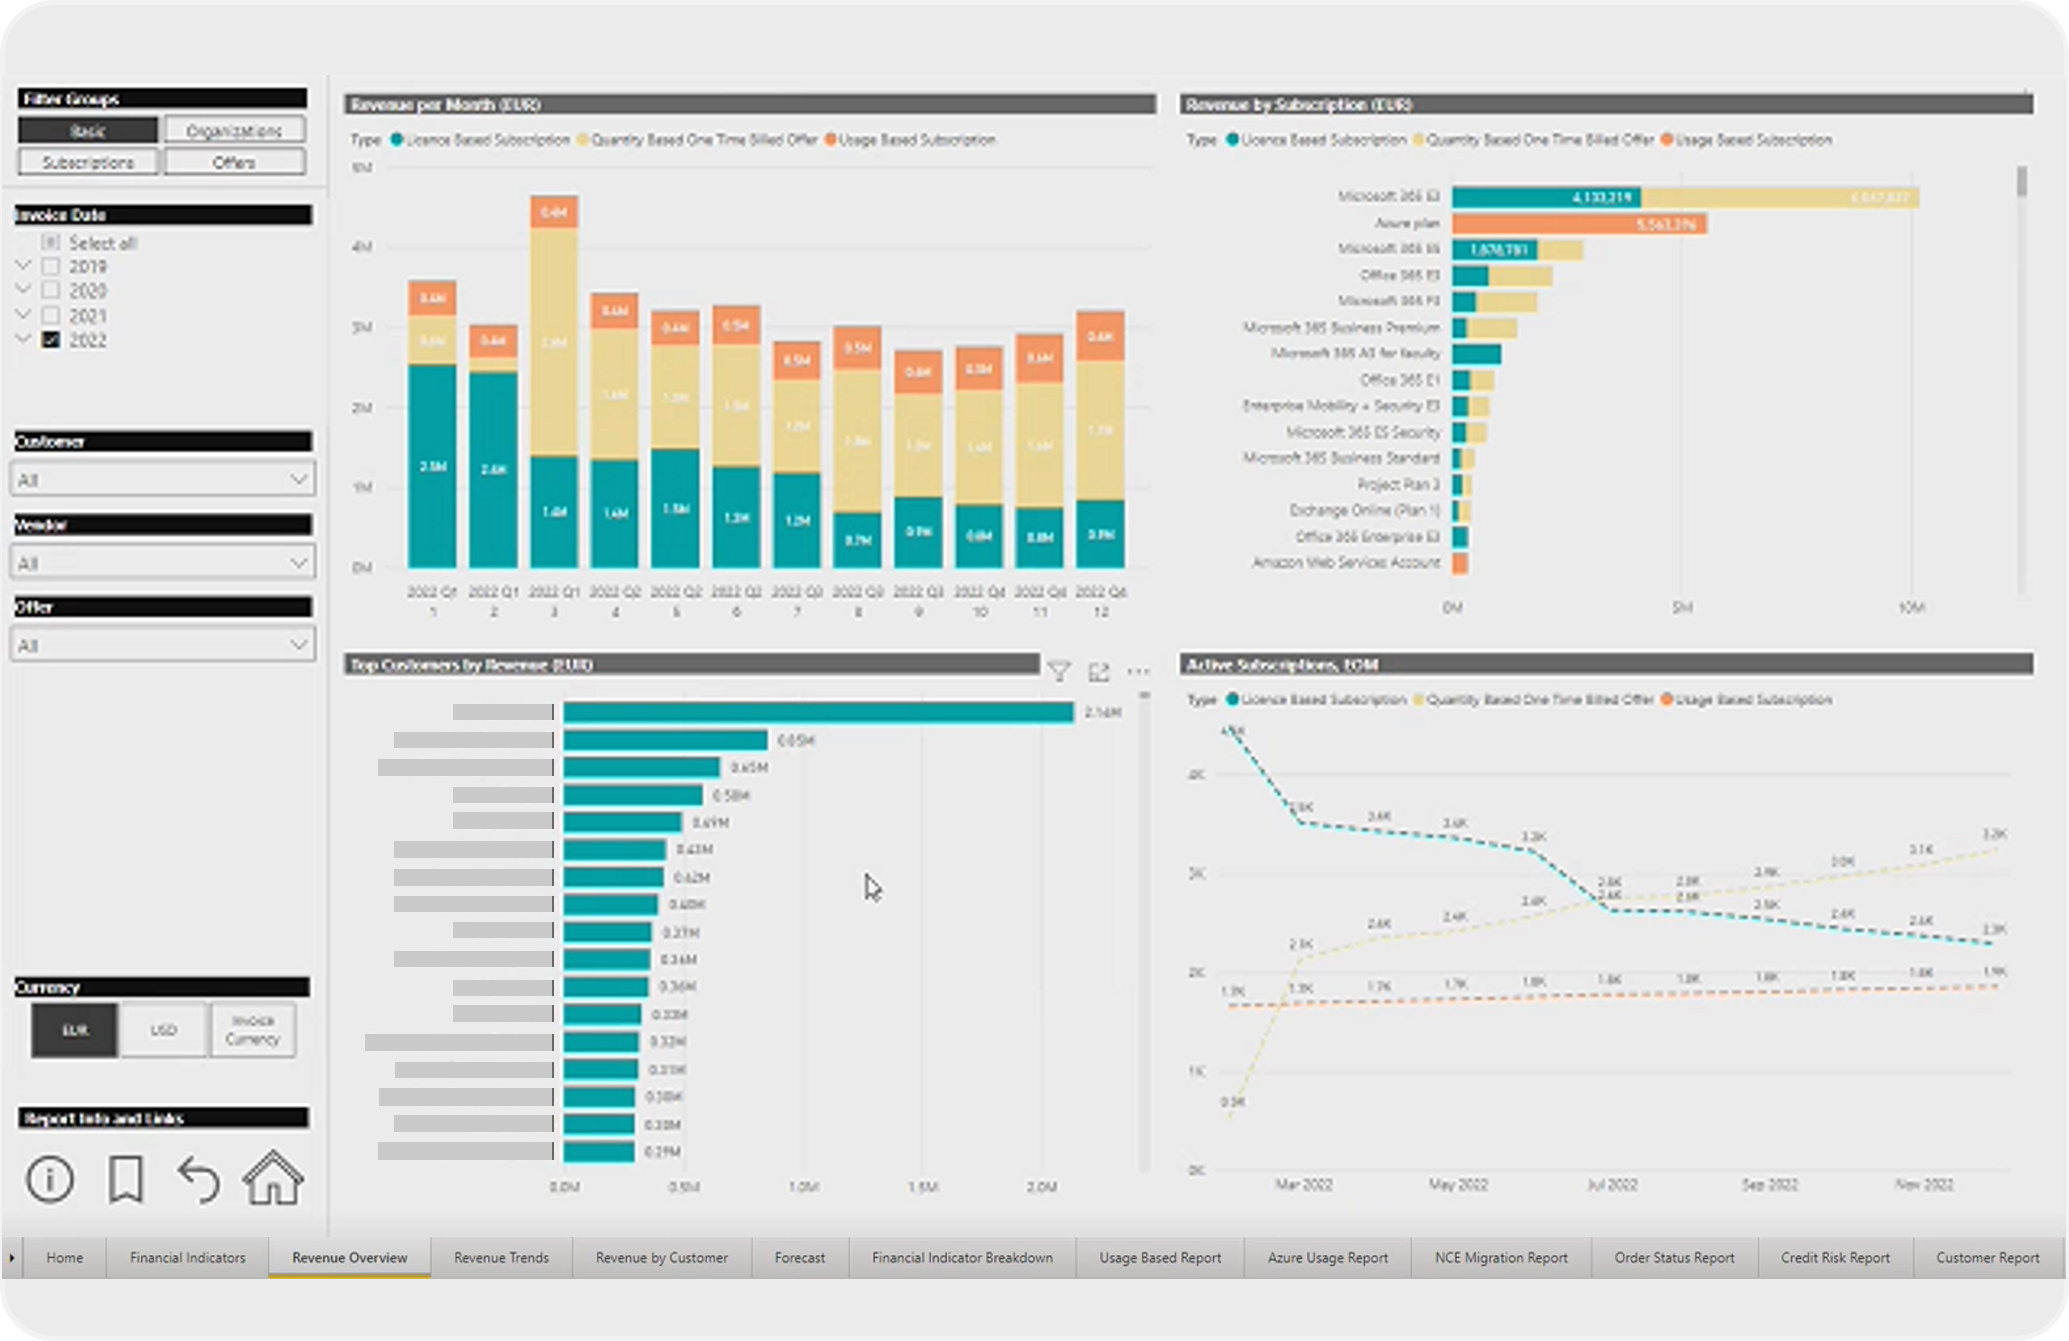
Learn More About Most Used Reports in AppXite Platform
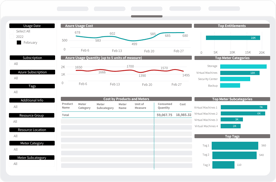
Azure Usage Report
Enjoy near-daily updates on your Azure subscription data at a deeper, more granular level than before.
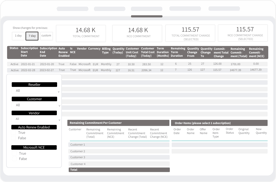
Credit Risk Report
Monitor all recent changes in the total amount your resellers and customers have committed for subscriptions.
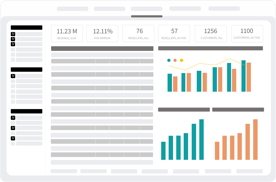
Revenue Overview Report
Understand the performance of your subscription business with an in-depth analysis of your revenue.
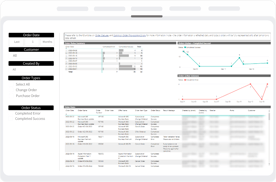
Order Status Report
Track all orders placed through the platform - monitor recent new purchases or orders rejected by the vendor.
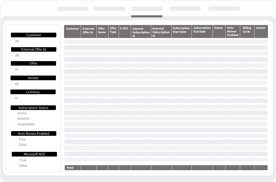
Subscription Report
View all the events related to a particular subscription - upgrades, downgrades, renewals, and more - in one place.
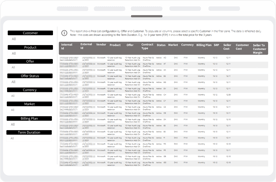
Price List Report
Review the detailed price information and configuration by offer and customer for NCE and other offers.
Trusted by Leading Tech Companies Across the Globe


Steinar Sønsteby
CEO – Atea
Kees Hertogh
Senior Director, Product Marketing – Microsoft
Todd Törnquist
CCO – Hive
Anders Nilsson
CEO – LIVE arena
.png)


